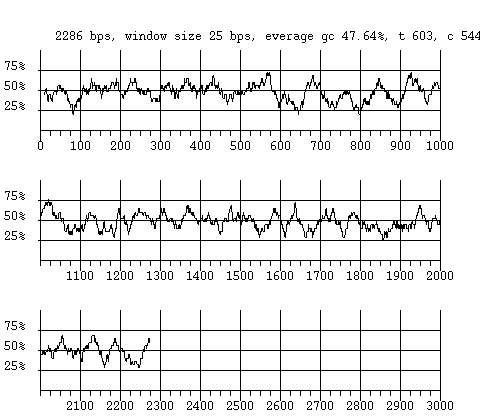
Note that maximum length to be plotted is 1 mega-base (from the start base) and, if the plotted reqion is longer than 10000 bps, the plot will be broken into multiple images. So if your sequence is longer than 1 mega-base, only the first 1 mega-base will be plotted if you don't specify a start base. To get plot for reqions beyond 1 mega-base, you need to specify a start base to skip the sequences before the start base. For example, if you sequence has 2 mega-bases and to get the plot for the second mega-base, you need to specify the start base as 1000001.
Example plot:
